OCI Monitoring
Introduction
The Oracle Cloud Infrastructure Monitoring service enables active and passive monitoring of cloud resources using the Metrics and Alarms features. Read more details here
This section focuses on monitoring system metrics of OKE (Oracle Cloud Infrastructure Container Engine for Kubernetes).
Pre-Requisites
Deploy MuShop
OKE Cluster Metrics
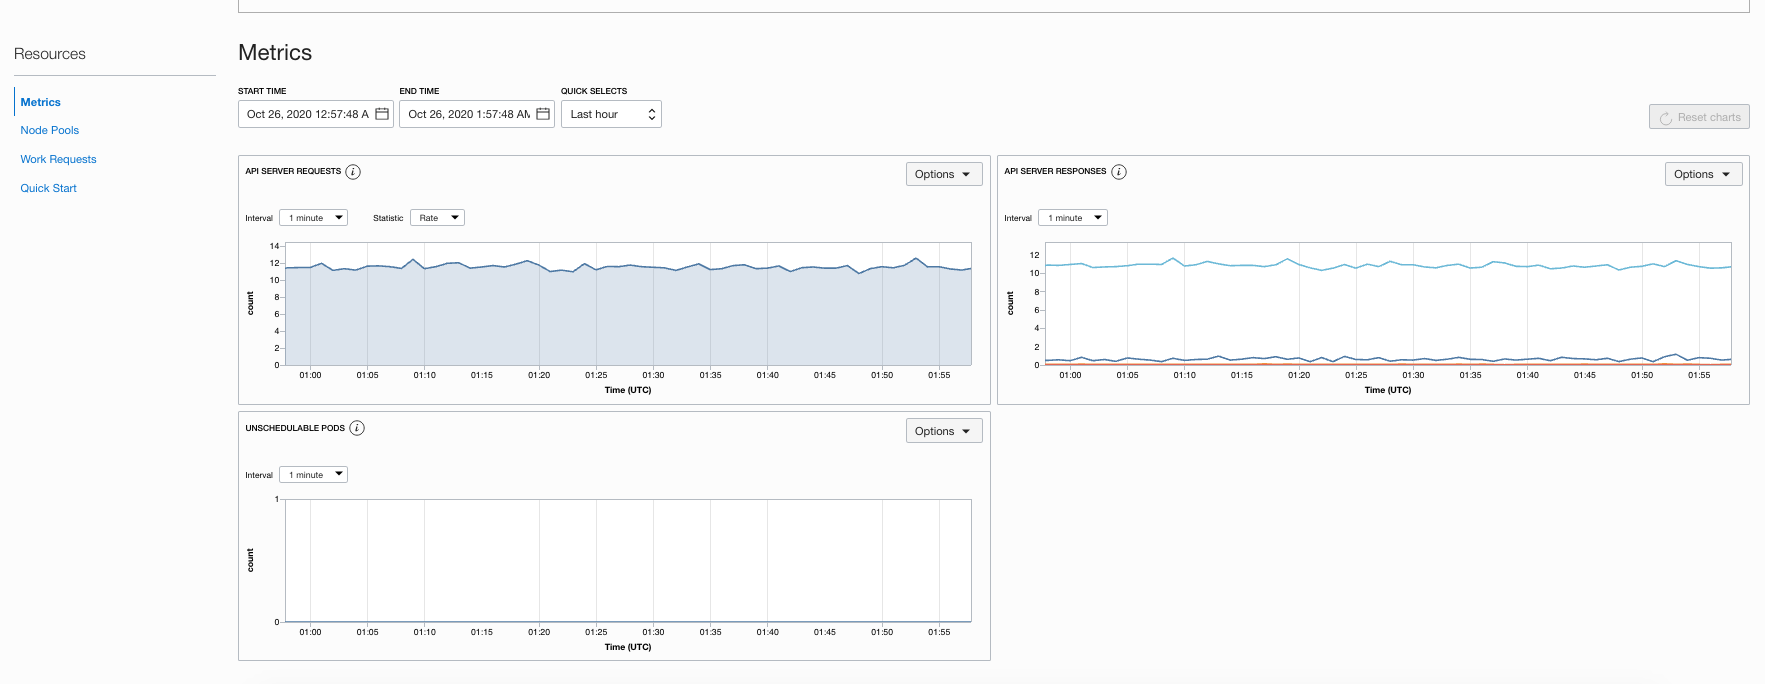
Navigate to Developer Services -> Kubernetes Clusters -> <Your_Cluster_Name>
Under Resources -> Metrics observe the following metrics
- Unschedulable pods, which can be used to trigger node pool scale operations when there are insufficient resources on which to schedule pods
- API Server requests per second, which is helpful to understand any underlying performance issues seen in the Kubernetes API server.
These metrics can also be viewed from OCI Monitoring console under “oci_oke” namespace. Additionally, alarms can be created using industry standard statistics, trigger operators, and time intervals.
OKE Node Pool Metrics
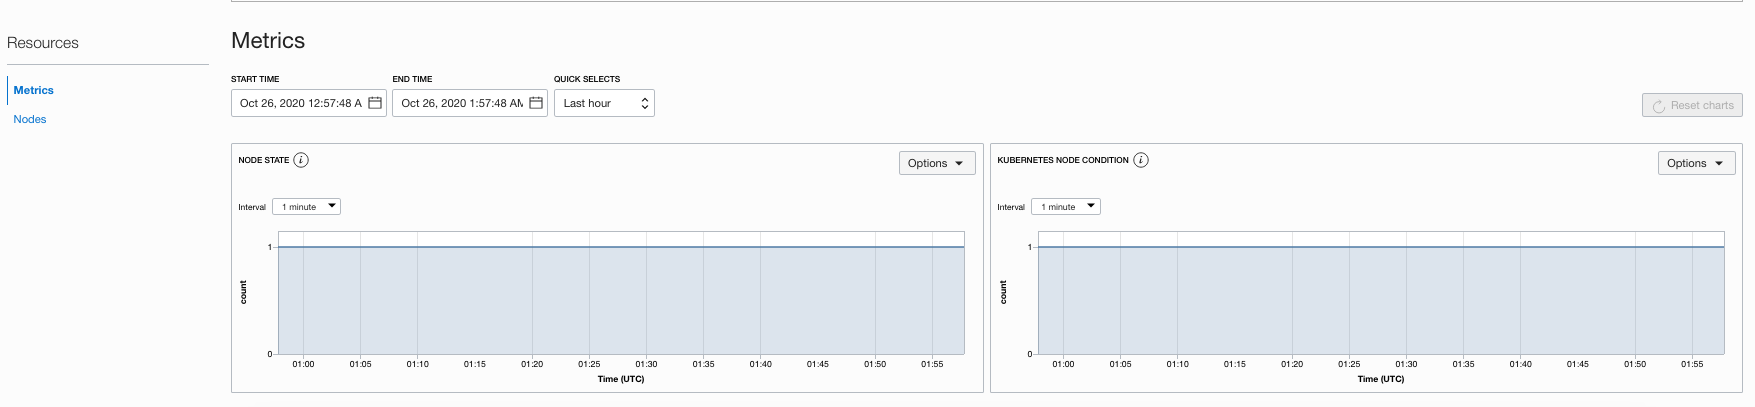
Navigate to Developer Services -> Kubernetes Clusters -> <Your_Cluster_Name> -> Node Pools -> <Your_Node_Pool_Name>
Observe the following node pool metrics:
- Node State (If your worker nodes are in Active state as indicated by OCI Compute Service)
- Node condition (If your worker node are in Ready state as indicated by OKE API server)
OKE Worker Node Metrics
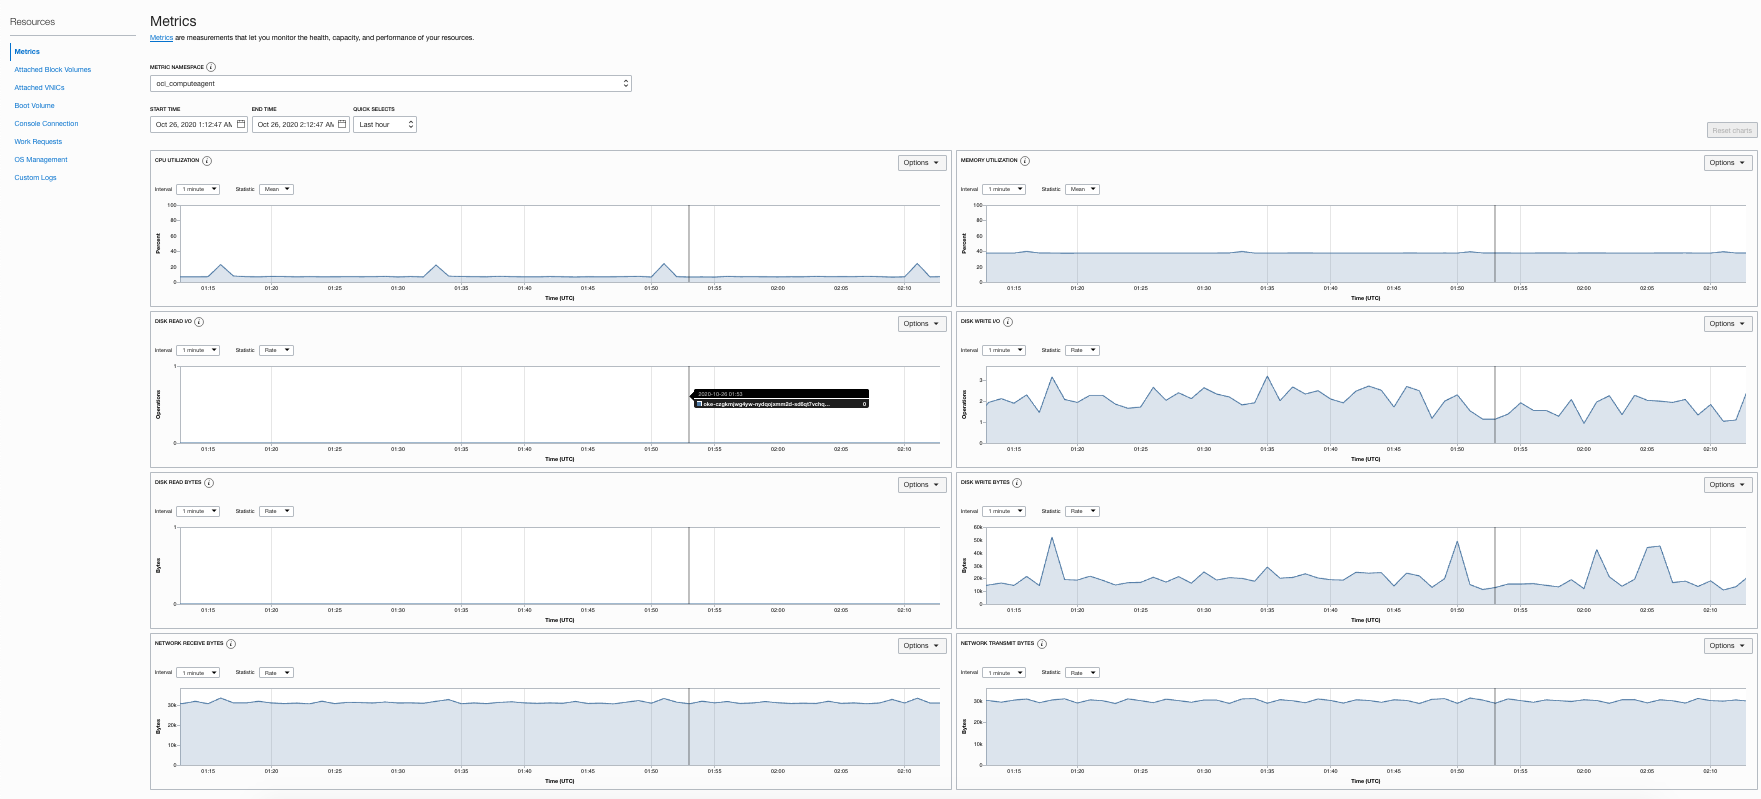
Navigate to Developer Services -> Kubernetes Clusters -> <Your_Cluster_Name> -> Node Pools -> <Your_Node_Pool_Name> -> Nodes -> <Your_Node_Name>
Observe the following node metrics:
- Activity level from CPU. Expressed as a percentage of total time (busy and idle) versus idle time. A typical alarm threshold is 90 percent.
- Space currently in use. Measured by pages. Expressed as a percentage of used pages versus unused pages. A typical alarm threshold is 85 percent.
- Activity level from I/O reads and writes. Expressed as reads/writes per second.
- Read/Write throughput. Expressed as bytes read/Write per second.
- Network receipt/transmit throughput. Expressed as bytes received/transmit per second.
Accessing via CLI
This is an example to show how metrics can also be accessed via OCI CLI. API Server Requests metric with a 5 minute interval accessed via the CLI (some of the telemetry data was manually removed in order for it to fit better on the page)
$ oci monitoring metric-data summarize-metrics-data --namespace oci_oke --compartment-id ocid1.compartment.oc1... --query-text='(APIServerRequestCount[5m]{ clusterId="ocid1.cluster.oc1.eu-zurich-1"}.rate() )'
{
  "data": [
    {
      "aggregated-datapoints": [
        {
          "timestamp": "2020-03-12T15:47:00+00:00",
          "value": 9.24907063197026
        },
        {
          "timestamp": "2020-03-12T15:52:00+00:00",
          "value": 9.20446096654275
        },
        {
          "timestamp": "2020-03-12T15:57:00+00:00",
          "value": 9.22962962962963
        },
      ],
      "compartment-id": "ocid1.compartment.oc1..",
      "dimensions": {
        "clusterId": "ocid1.cluster.oc1.eu-zurich-1",
        "resourceDisplayName": "monitoring",
        "resourceId": "ocid1.cluster.oc1.eu-zurich-1"
      },
      "metadata": {
        "displayName": "APIServer Requests",
        "unit": "count"
      },
      "name": "APIServerRequestCount",
      "namespace": "oci_oke",
      "resolution": null,
      "resource-group": null
    }
  ]
}
Cleanup (Optional)
MuShop Cleanup refer